Exasol Admin
Learn about the web-based administration interface in Exasol.
Introduction
Exasol Admin is an easy-to-use web interface that allows you to carry out common administration tasks such as monitoring your database, generating and analyzing logs, creating backup schedules, updating Exasol, and managing files in BucketFS.
Exasol Admin is available in Exasol 2025.1 and later.
In a new deployment of Exasol, you must enable Exasol Admin in the deployment configuration during the installation procedure. To learn more, see Install Exasol - step by step.
If you are updating to Exasol 2025.1 or later from an earlier rolling release version of Exasol 8, there is no step to enable Exasol Admin during the update procedure. Instead you have to manually enable Exasol Admin after the update. For more information, see Enable Exasol Admin after updating.
This article provides an overview of how to use Exasol Admin. For more details about each function, use the links to the related sections in the documentation.
How to access Exasol Admin
Exasol Admin can be enabled on all cluster nodes. To access the interface, open a web browser and enter the public IP address of a node with the port 8443. For example: https://203.0.113.123:8443
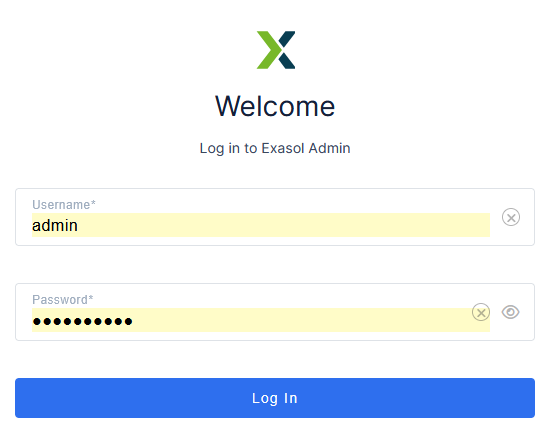
To log in to Exasol Admin, enter the username admin
and the password that you specified when you deployed the cluster. For more information about passwords, see Configure the deployment.
Databases
The Databases page shows all databases in the cluster and the status of the cluster nodes. You can also stop and start your databases from this page.
Information about the currently selected database is presented in the lower half of the window. If there are more than one database in the cluster, information for the first database in the list is shown by default.
To hide the information pane, click on the button.
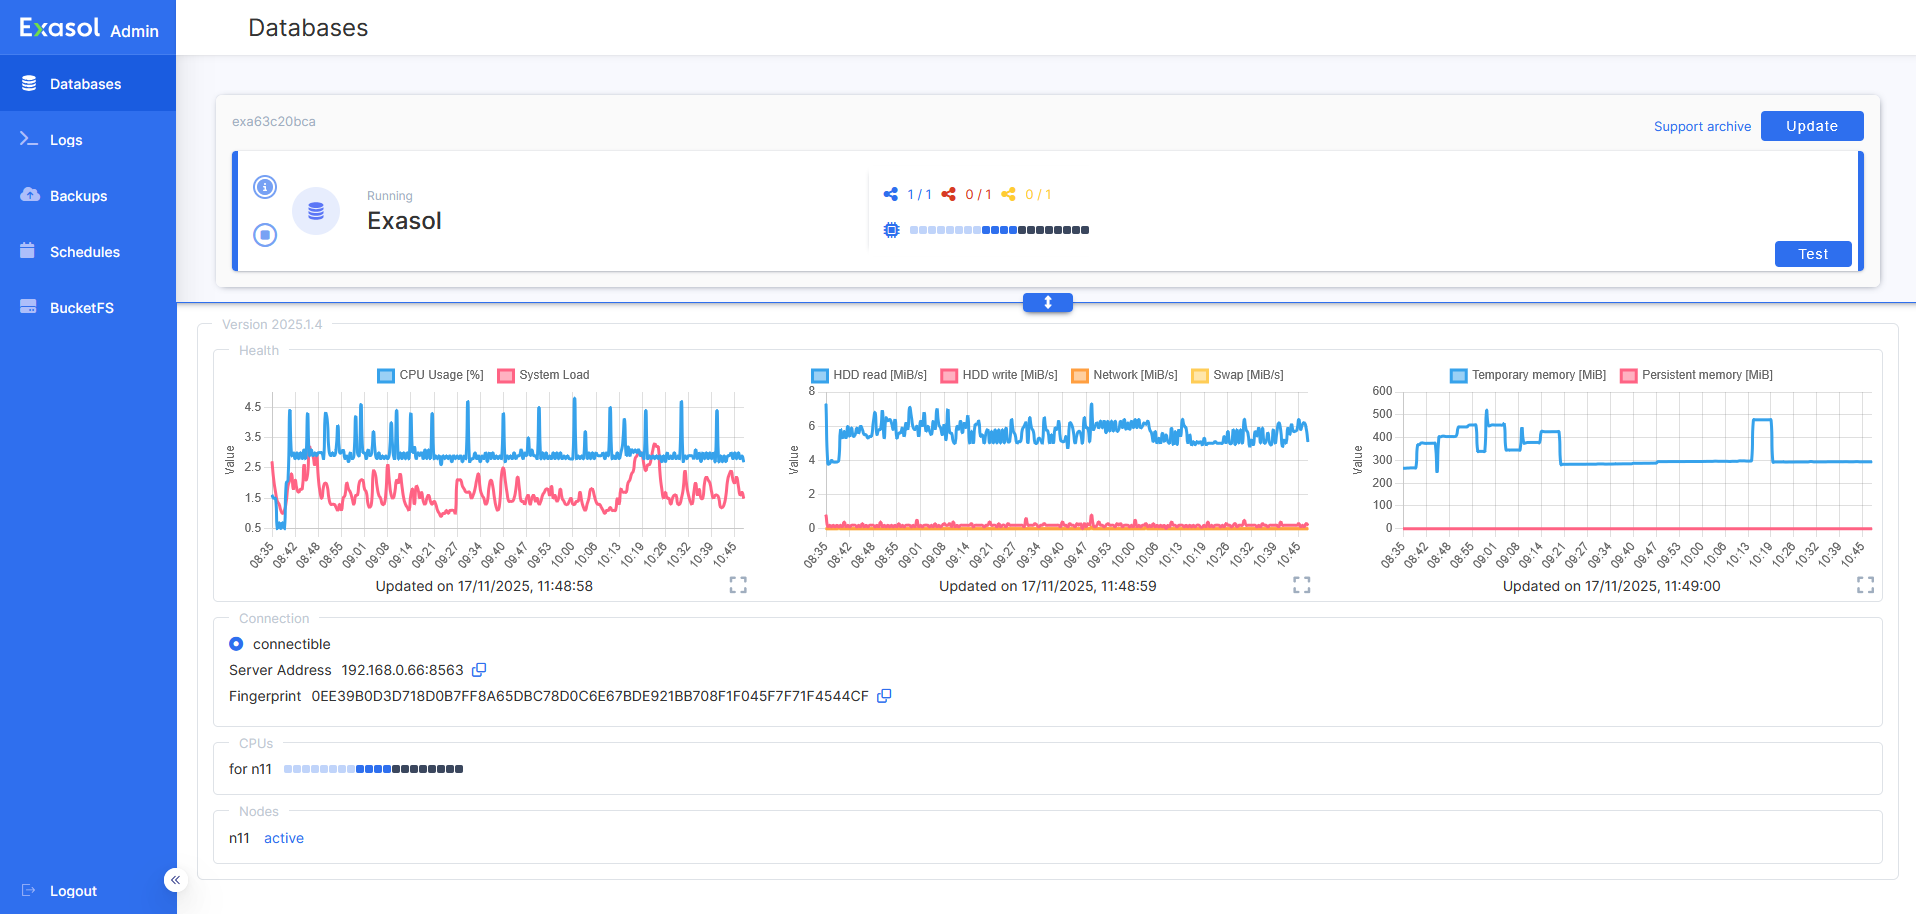
Explanation of the buttons on the Databases page
| Support archive | Opens the Support archive page. This page allows you to create an archive with logs and other system information that will be required by our Support team if you open a support case. To learn more, see Log files for support. |
| Update | Opens a dialog that allows you to update your database to a new version of Exasol. To learn more, see Update Exasol. |
| Test | This button can be used to test the status of the connection to the database. A checkmark on the button indicates that the test was successful. |
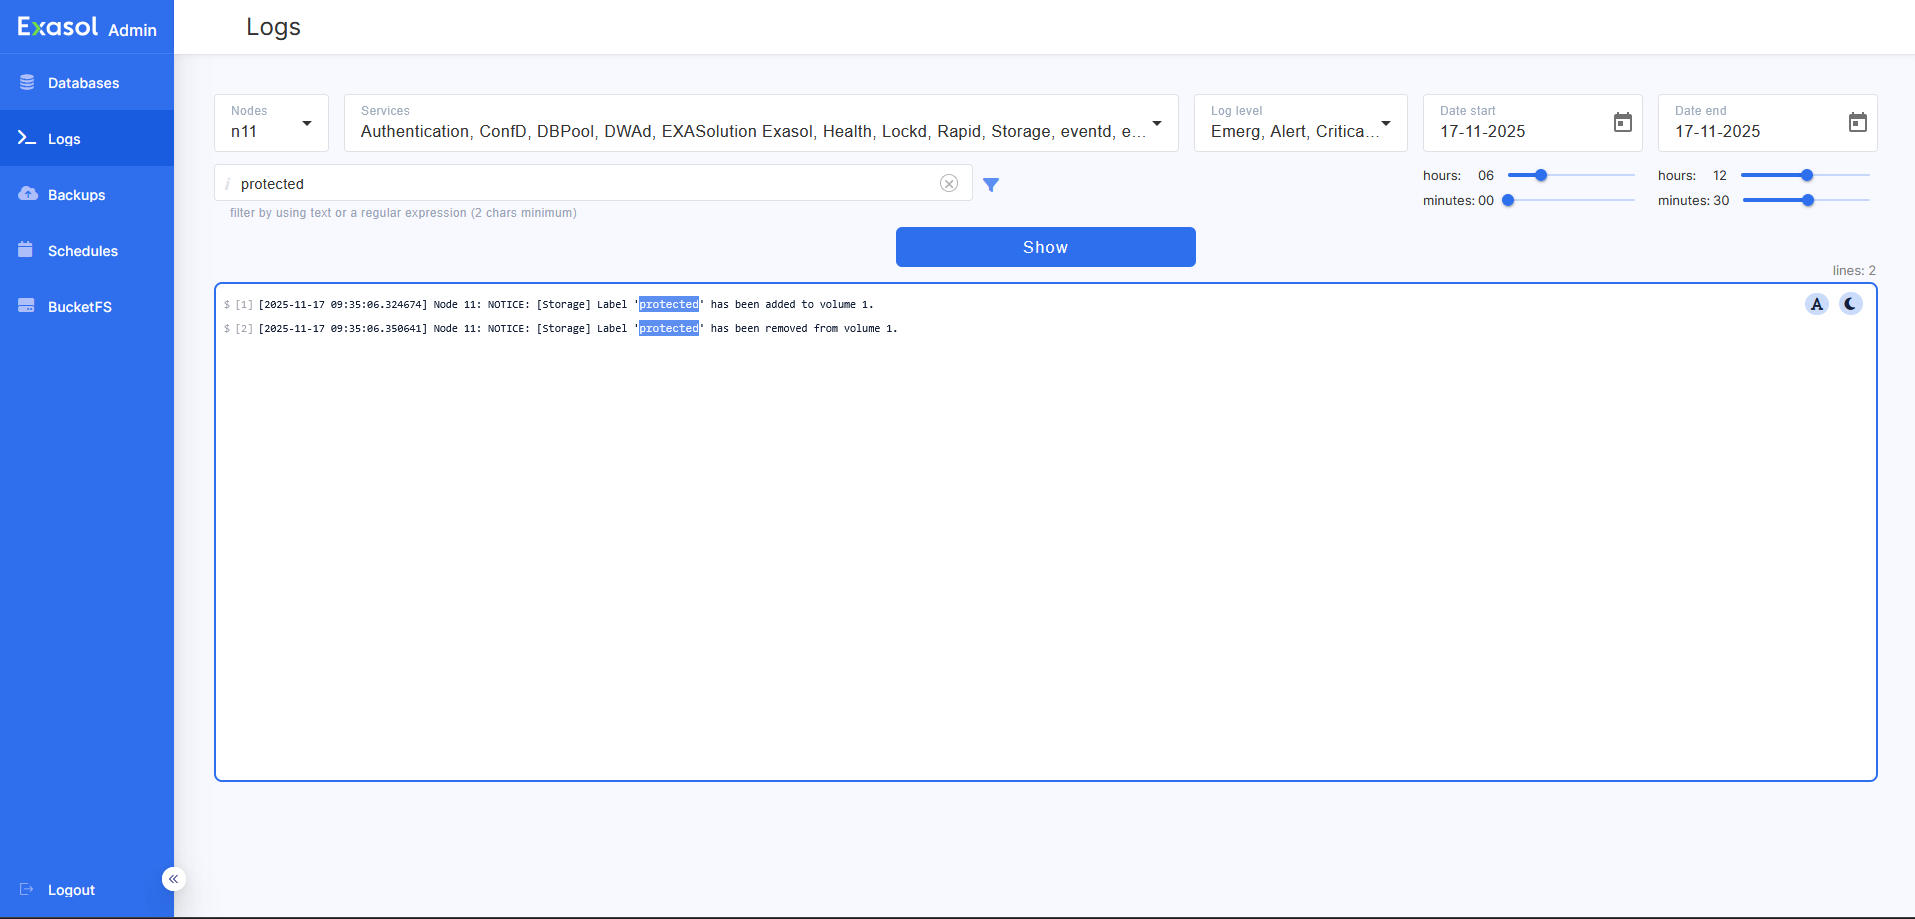
Logs
The Logs page allows you to collect system logs from the cluster. You can choose which logs to collect, select a log level and time interval, and filter by text or regular expressions.
To learn more about logs and how to monitor your system, see Monitoring.
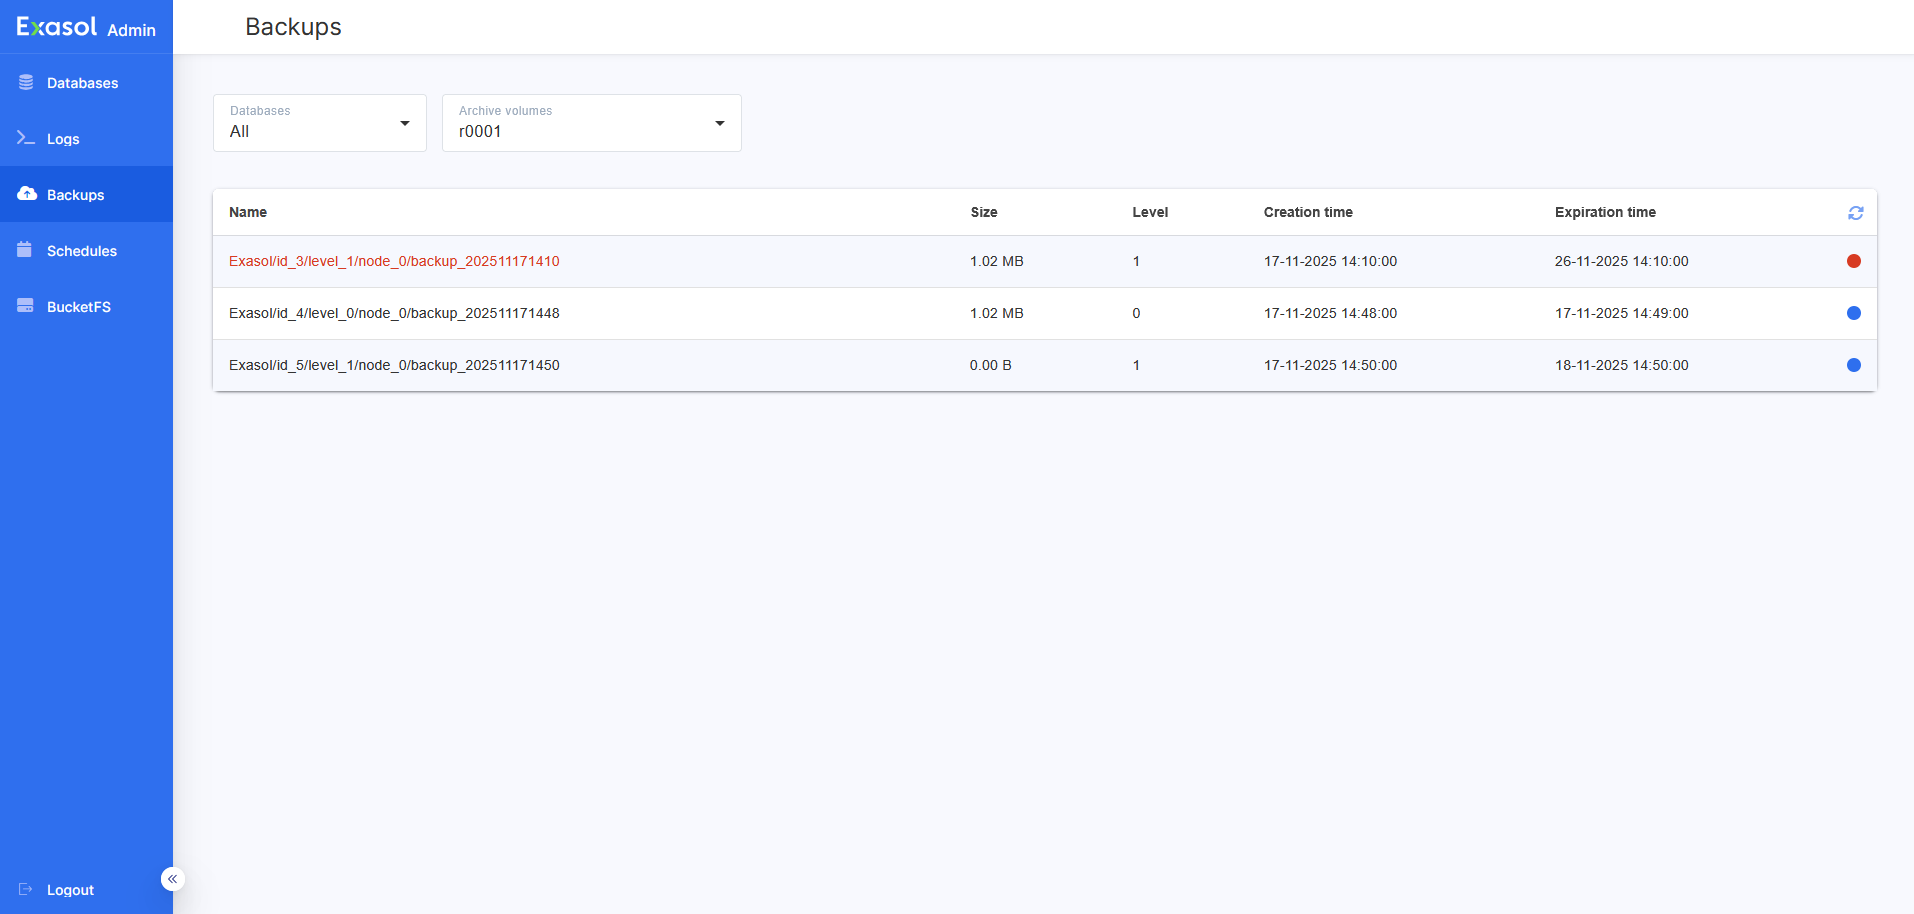
Backups
The Backups page lists existing backups on archive volumes associated with the databases in the cluster. You can choose to show all backups on a selected archive volume, or only the backups for a specific database. Backups that can be used to restore the selected database are indicated with a green checkmark.
To learn more about how to use backups in Exasol, see Backup and restore.
You cannot remove a backup or start a manual backup from the Backups page.
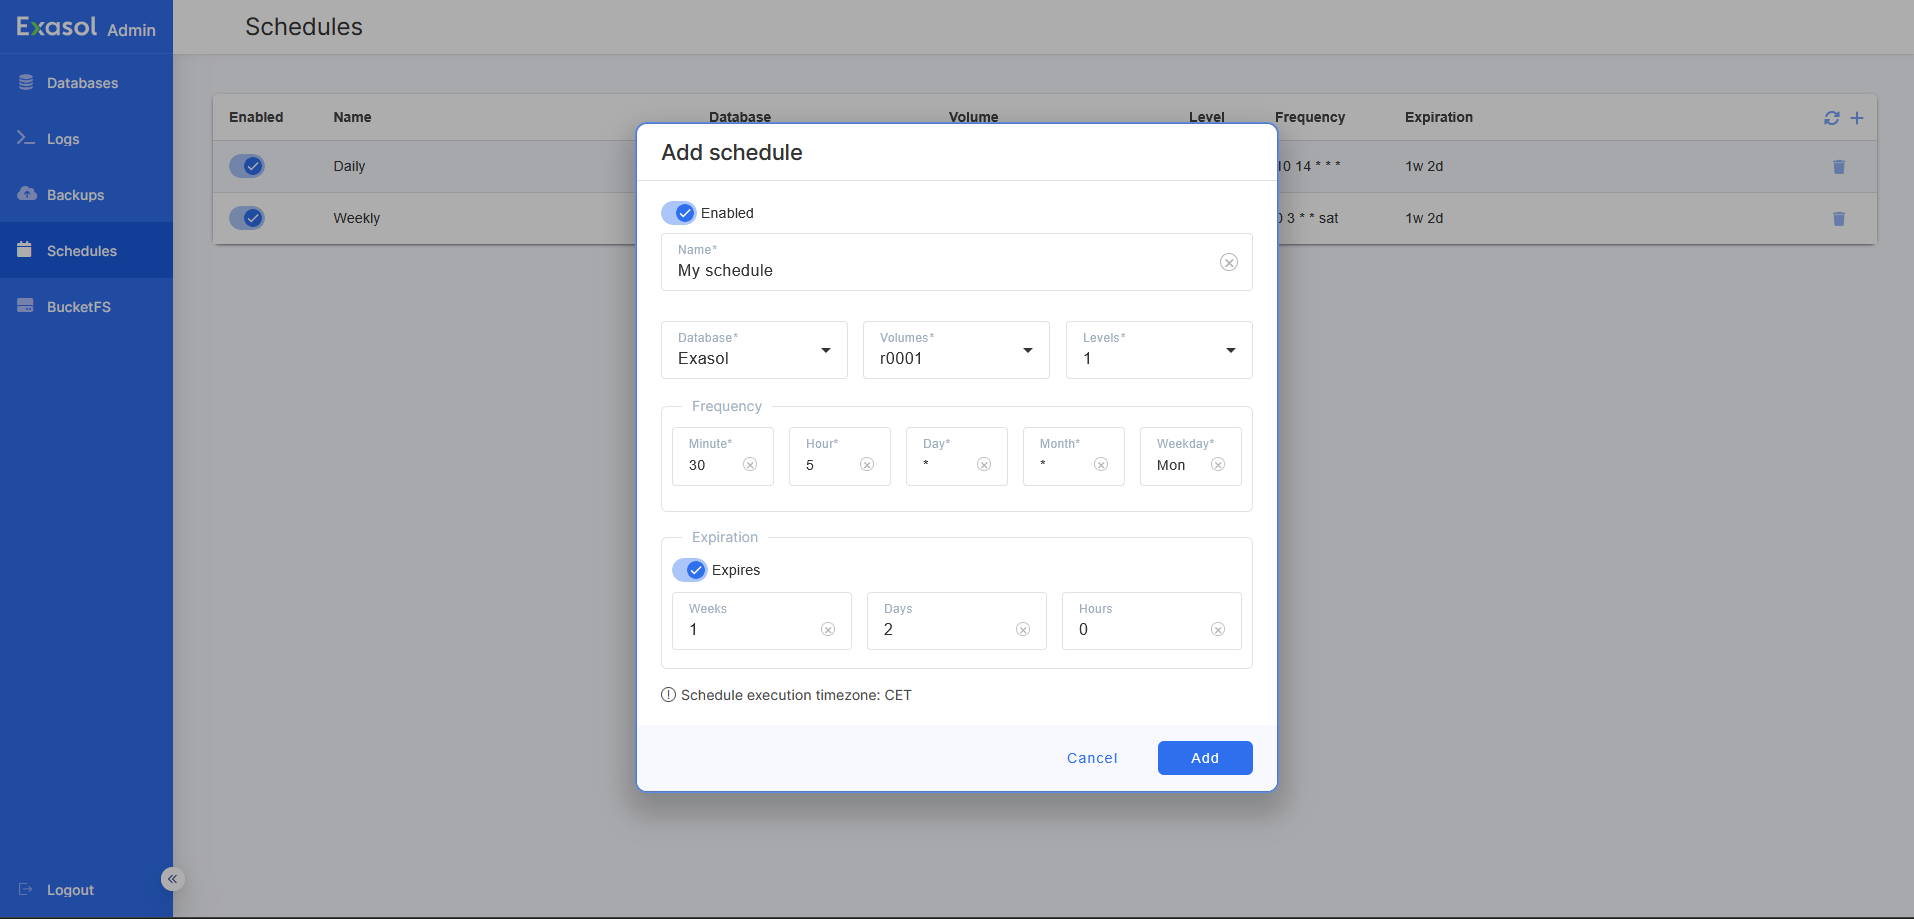
Schedules
The Schedules page allows you to create and manage backup schedules for your databases. You can create, delete, enable and disable schedules as needed.
To learn more, see Create backup schedule.
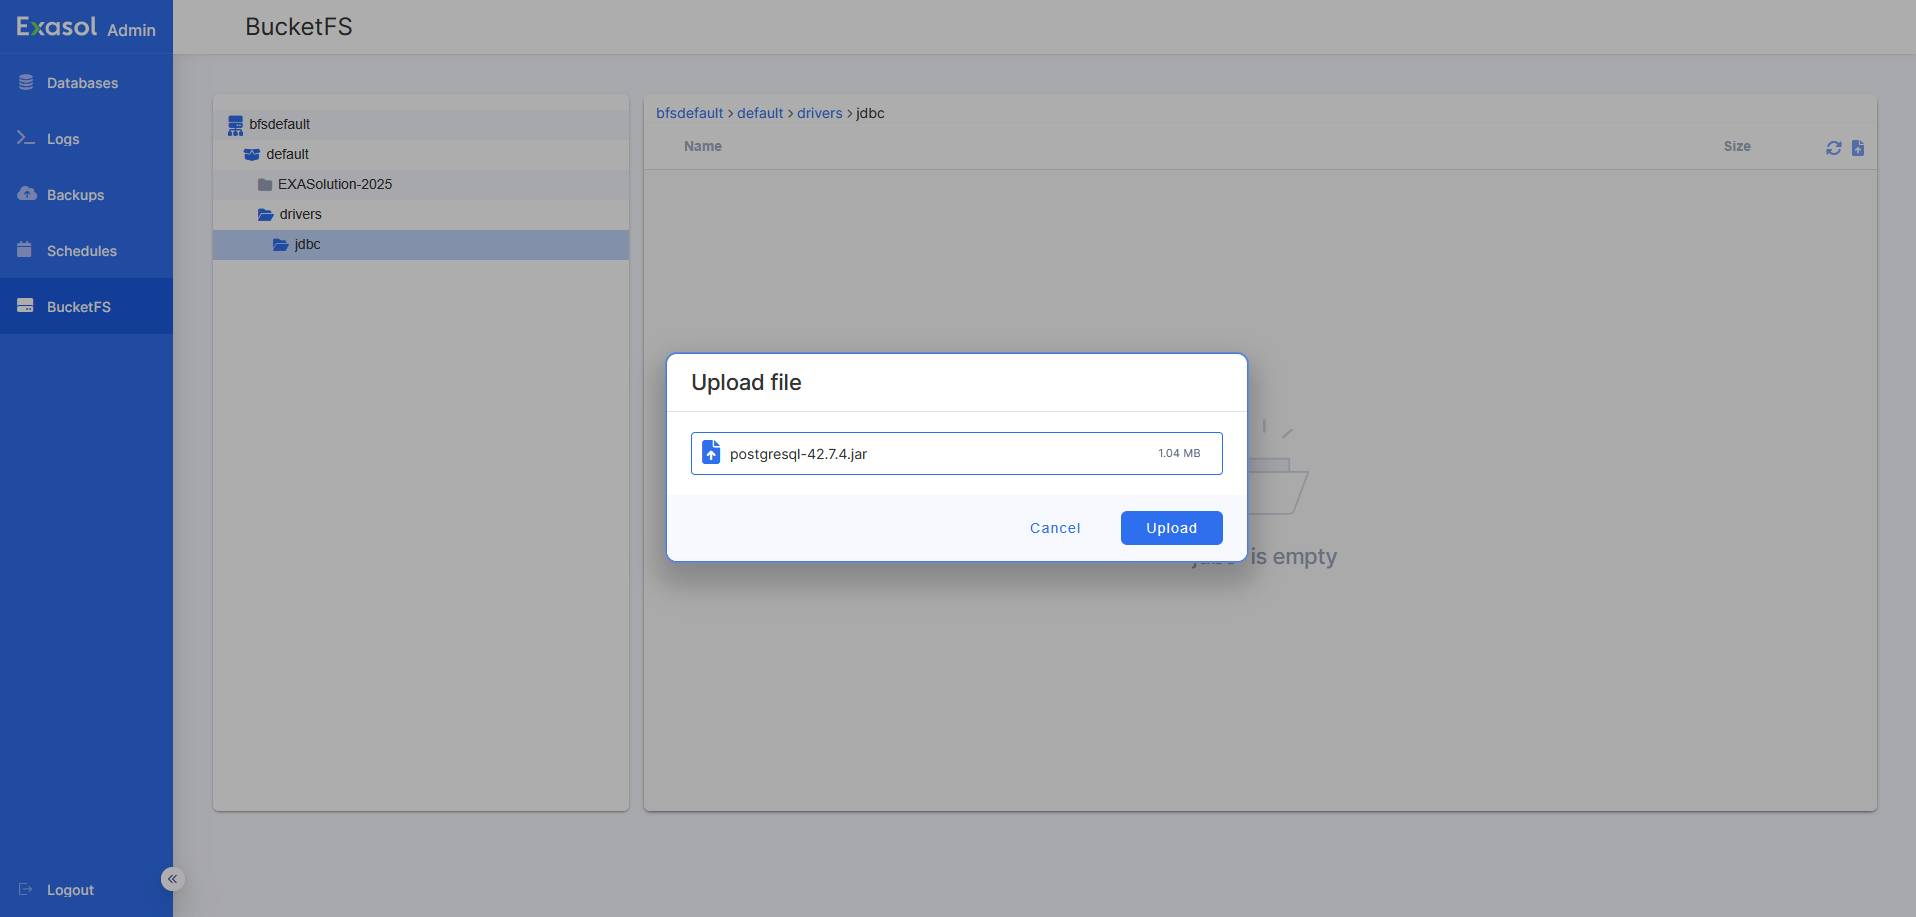
BucketFS
The BucketFS page enables you to create and manage buckets and files in BucketFS on the database.
To learn more about how to use BucketFS, see BucketFS.
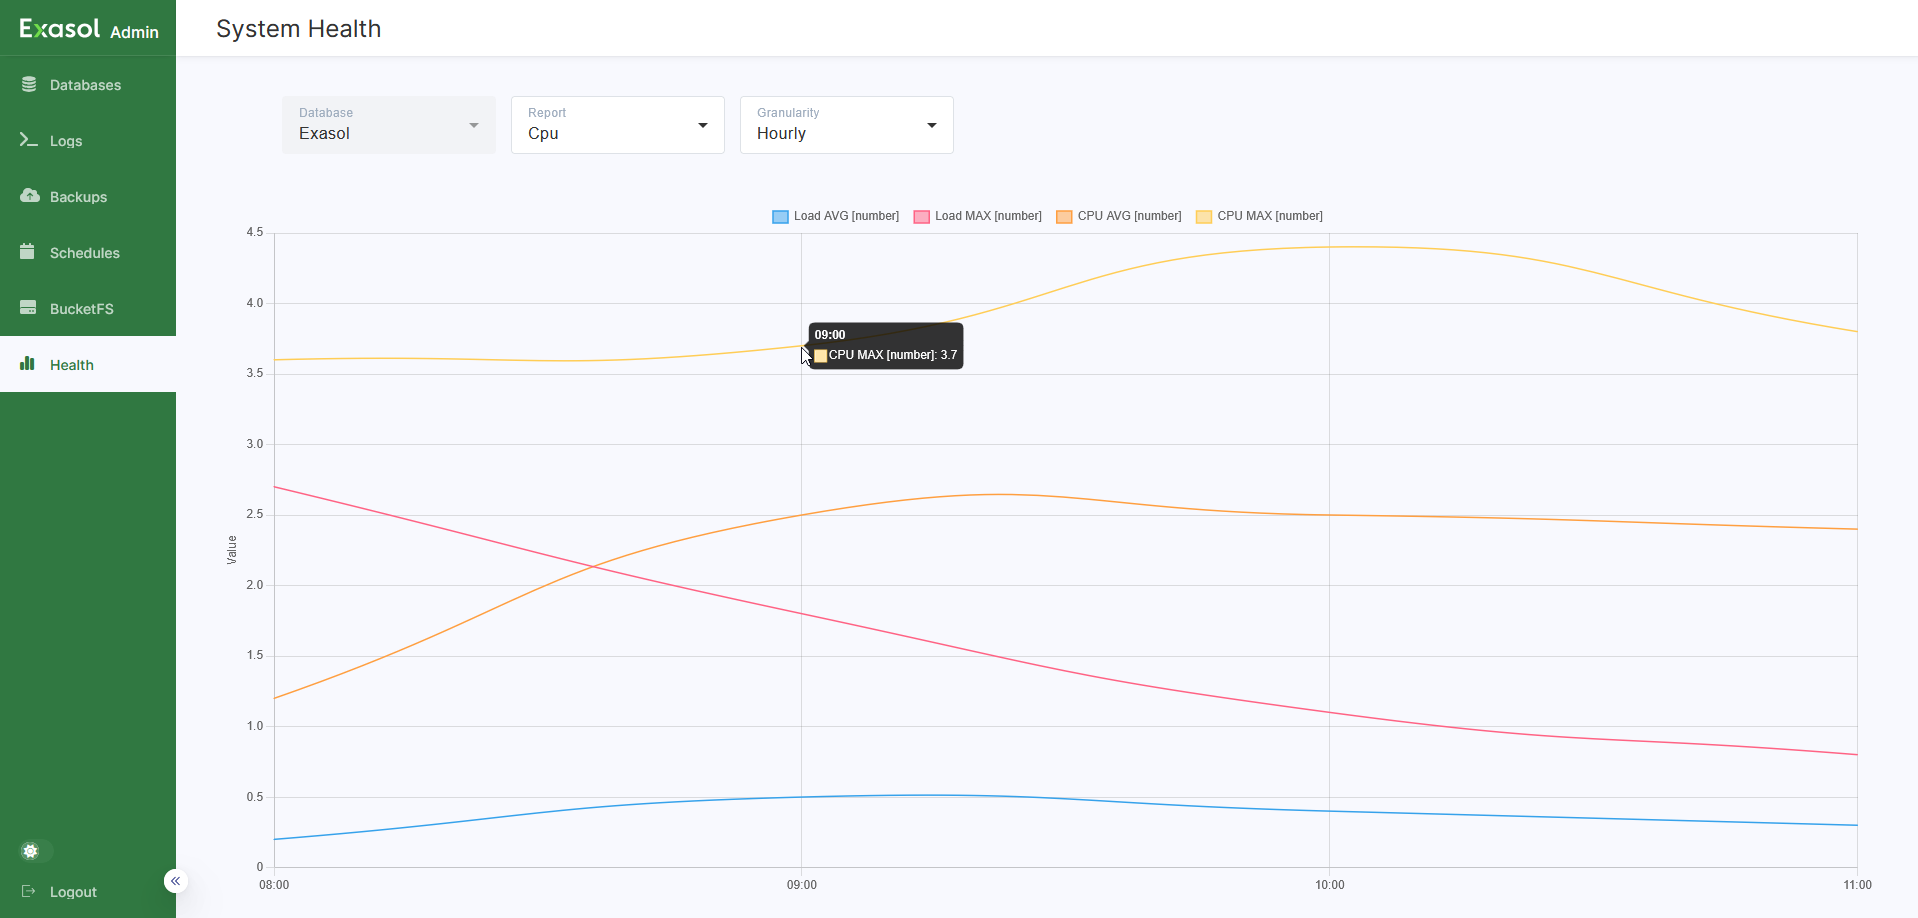
Health
This page is only available in Exasol 2025.2 and later.
The Health page enables you to generate hourly, daily, and monthly status reports for each database in the cluster in diagram format. Reports can be generated for CPU usage, data I/O, disk memory usage, RAM usage, the number and duration of SQL transactions, as well as general usage statistics.
To view the value at a specific data point on a curve, hover the cursor over the intersection of the curve and the grid line.