Learn how to install and use the Exasol R package with a sample data set.
Exasol provides a package for R that you can use to connect to an Exasol database and transfer data between the database and your R environment. The Exasol R package includes low-level functions that are optimized for reading and writing data on an Exasol database in a multi-node cluster.
Prerequisites
Basic knowledge about how to use R and Exasol is presumed.
To use the Exasol R package you need the following:
- R programming language
- Exasol R Package
- Exasol ODBC Driver
- An R development environment, such as RStudio
- A running Exasol instance
Installation
Install R developer tools
R developer tools are required when building R packages from source.
- Linux: Install the
R-devel(RPM) orr-base-dev(Debian) package. - Windows: Download and install the Rtools package for your version of R from the CRAN RTools download page.
Install ODBC driver
Download and install the Exasol ODBC driver for your environment by following the instructions in ODBC driver.
We recommend that you create a DSN pointing to your database instance.
Install ODBC development files (Linux only)
If your R development environment is running on a Linux system, you also need to install the ODBC development package unixodbc-devel (RPM) or unixodbc-dev (Debian).
Install devtools
The devtools package in R is used to install the Exasol R package. If the devtools package is not installed, run the following command in your R environment:
install.packages("devtools")Install Exasol R package
To install the Exasol R package, run the following devtools command:
devtools::install_github("EXASOL/r-exasol")
        # add the Exasol R library
        library(exasol)
To get help with the Exasol R package, you can use the following commands in R:
?exasol |
Shows package documentation with examples for each method. |
?dbConnect |
Shows documentation of individual commands with Exasol-specific parameters. |
Connect to Exasol
To connect to an Exasol database in R, use the dbConnect function to create a new connection exaconn.
Change the IP address and authentication details in the following examples with your own values.
Example:
# connect to the Exasol database using an ODBC DSN
exaconn <- dbConnect(
    drv         = "exa",                  # EXAdriver object
    exahost     = "192.168.56.103:8563",  # IP address of database cluster
    uid         = "sys",                  # database user
    pwd         = "sfg6yiH#bs78*7fijh_"   # database user password
)            # Password

# list all tables in the Exasol database (returns a character vector)
dbListTables(exaconn)
Connect using DBI
You can use the DBI package in R to connect to an Exasol database. In this case you may need use the ::: operation to call the dbConnect function. For example, exasol:::dbConnect.
TLS fingerprint
TLS encryption is required by default for all connections to Exasol. If TLS encryption cannot be used, you can include the server fingerprint in the connection string to bypass TLS validation.
Example:
exaconn <- dbConnect(
    drv = "exa",
    exahost = "192.168.56.103:8563",
    uid = "sys",
    pwd = "sfg6yiH#bs78*7fijh_",
    fingerprint = "72975B4D331DEEB44FA41FB858A5417E163151BBFB45376574706800A8DCCE30")
Write data
To write data into an Exasol database from R, use the exa.writeData function in the Exasol R package. This is a low level function which is faster than the dbWriteTable function provided by DBI.
-
Load data into R
First, load some data into R from the
BostonHousing
sample data set in themlbenchlibrary.Copy# add the "mlbench" library containing the "BostonHousing" sample data set
library(mlbench)
# load data into R
data("BostonHousing") -
Create a schema and table
Create a new schema and table in the Exasol database to store the test data. In this example we use the RODBC package, which implements ODBC database connectivity in R.
Copy# create a new schema "r_demo"
odbcQuery(exaconn,
"CREATE SCHEMA IF NOT EXISTS r_demo"
)
# create a table with the name "boston_housing"
odbcQuery(exaconn,
"CREATE OR REPLACE TABLE r_demo.boston_housing(
crim DOUBLE,
zn DOUBLE,
indus DOUBLE,
chas VARCHAR(10),
nox DOUBLE,
rm DOUBLE,
age DOUBLE,
dis DOUBLE,
rad DOUBLE,
tax DOUBLE,
ptratio DOUBLE,
b DOUBLE,
lstat DOUBLE,
medv DOUBLE
)"
)
# verify that the table exists in the Exasol database
dbListTables(exaconn) -
Write data to the database
To populate the columns in the new table with data, use the
exa.writeDatafunction and specify the name of the connection, the name of the source data set, and the table name as arguments.Copy# write the data into Exasol
exa.writeData(exaconn, data = BostonHousing, tableName = "boston_housing") -
Verify the data
You can inspect the newly created table in the Exasol database by connecting with a SQL client.
CopySELECT * FROM r_demo.boston_housing;
Read data
The following example shows how to read the data in the Exasol database back into R using the exa.readTable function in the Exasol R package. This is a low-level function which is faster than the dbReadTable function in DBI.
As arguments in the function, specify the name of the connection that you created in Write data and the query to be executed on the database. The result of the query will be read into a data.frame object in R.
# read data from the database table and store it in the data.frame object "boston_housing_exasol"
boston_housing_exasol = exa.readData(exaconn, "SELECT * FROM boston_housing")
You can now use the example data in R by using the data frame boston_housing_exasol.
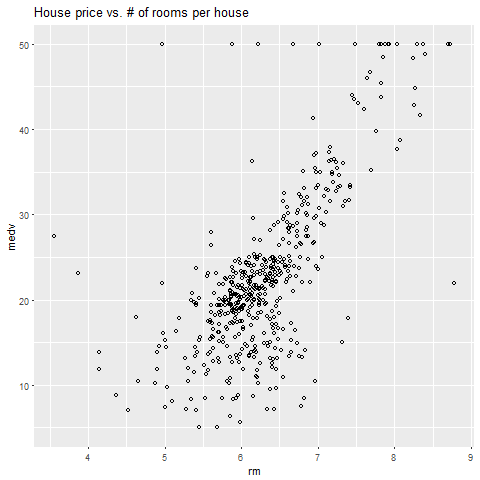
The following example creates a plot that shows MEDV (median house value) versus RM (rooms per house):
# plotting library
library(ggplot2)

bhplot = ggplot(boston_housing_exasol, aes(RM, MEDV)) +
geom_point(colour = "black", shape = 1) +
ggtitle("House price vs. # of rooms per house")

plot(bhplot)
Close connection
When done, use the dbDisconnect command to close the database connection.
dbDisconnect(exaconn)