Using Splunk for Monitoring
This article explains how you can install and configure Splunk to use with Exasol and collect logs and metrics.
Splunk is a third-party monitoring tool that you can use with Exasol for your system monitoring. To learn more about Splunk, see Splunk Documentation.
Installing Splunk Server
Prerequisites
- CentOS 7 operating system
- Splunk installer package for Linux
Installing Splunk
Do the following to install Splunk:
- Run the following command to install the package.
rpm -ivh splunk-7.3.1-bd63e13aa157-linux-2.6-x86_64.rpm
The installation directory is
/opt/splunk. - Start Splunk and enter username and password.
/opt/splunk/bin/splunk start
- Skip this step if
/etc/hostsis configured properly and the name resolution is working.Create an SSH port forward to access the Splunk Web UI.
ssh root@HOST-IP -L8000:localhost:8000
- Open the Splunk Web UI and log in.
https://localhost:8000
The username and password are the same as you created in earlier step.
Set Up Index to Store Data
Do the following to set up the index to store data:
- Log in to the Splunk Web UI.
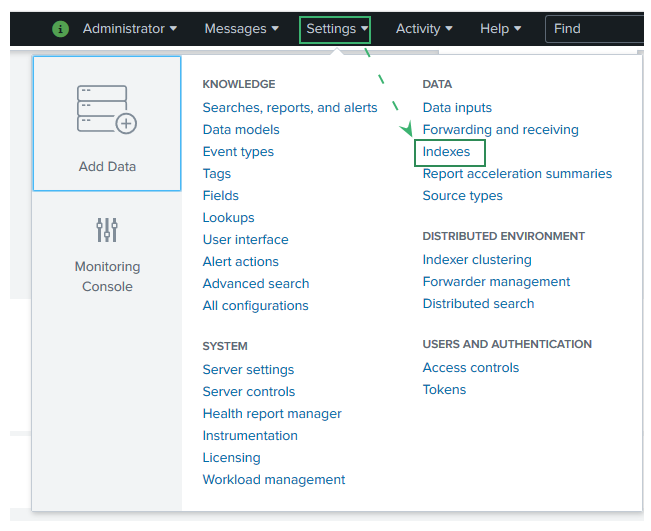
- Go to Settings > Indexer.

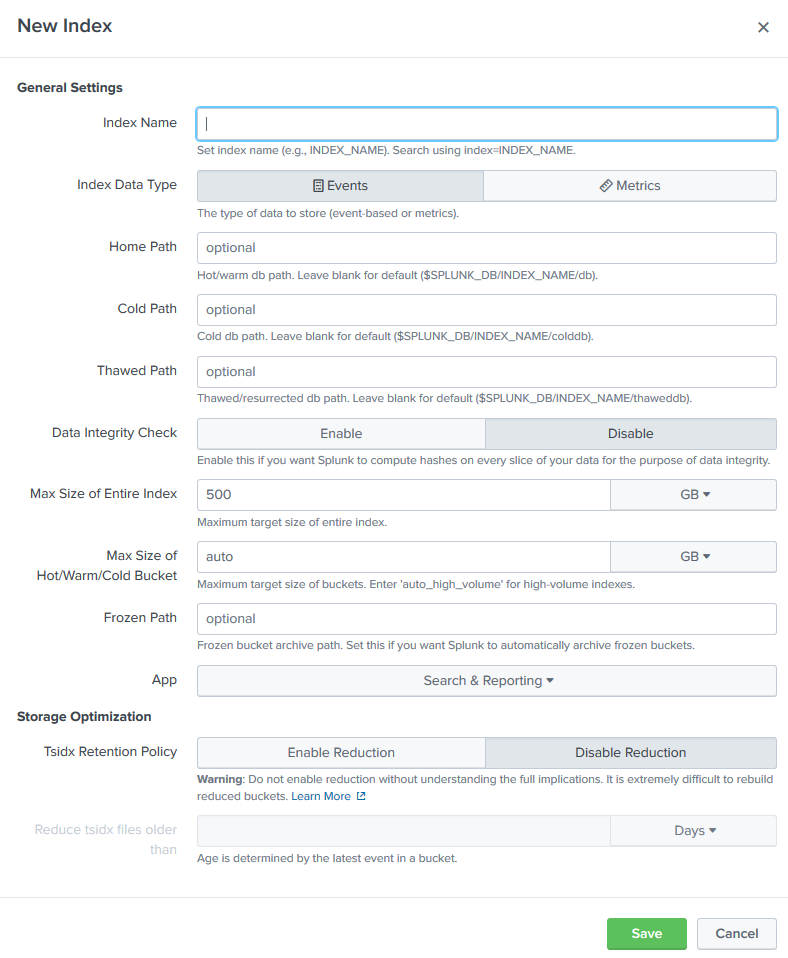
- Click New Index.
- On the New Index page, enter index name (remotelogs), type (event), and Max Size (20 GiB).

- Click Save.
Create a Listener to Receive Data
Do the following to create a listener to receive data:
- Log in to the Splunk Web UI.
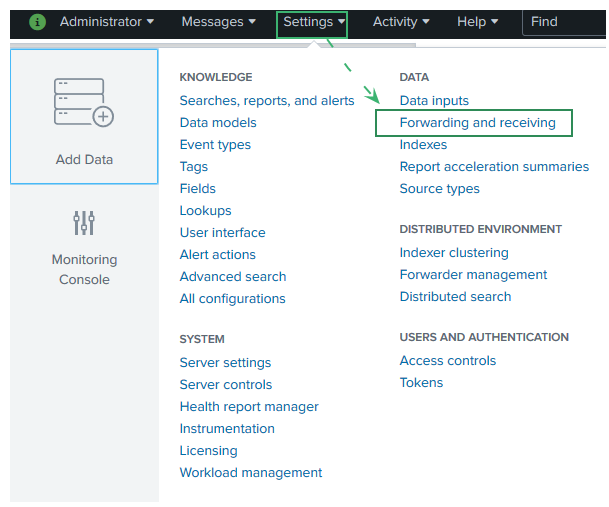
- Go to Settings > Forwarding and receiving.

- Under Receiving Data, click +Add New.

- Enter the port number in Listen to this port.
- Click Save.
- Do one of the following to restart Splunk:
- Run command
/opt/splunk/bin/splunk restart - In Splunk Web UI, go to Settings > Server Controls and click Restart Splunk.
- Run command
Install Splunk Universal Forwarder
Do the following to install the Splunk Universal Forwarder:
- Download the Splunk Forwarder package for Linux.
- Run the following command to install the package.
rpm -ivh splunkforwarder-7.3.1-bd63e13aa157-linux-2.6-x86_64.rpm
- Run the following command to start the Splunk Forwarder.
/opt/splunkforwarder/bin/splunk start
- Accept the EULA and enter the username and password (same as the Splunk Server).
Set Up Forward-server and Monitor
Do the following to set up a forward-server and monitor:
- Run the following command to add Splunk server as a server to receive forwarded log files:
/opt/splunkforwarder/bin/splunk add forward-server HOST-IP:9700 -auth <USER>:<PASSWORD>
The username and password in the above command are for the Splunk Server.
- Run the following command to add a log file to monitoring list.
/opt/splunkforwarder/bin/splunk add monitor /var/log/audit/audit.log -sourcetype linux_logs -index remotelogs
In the above command, log file name is added with its full path and index name is the one created in Set Up Index to Store Data.
- Run the following command to check if the forward server and log files are configured properly.
/opt/splunkforwarder/bin/splunk list monitor
Once you enter your username and password, you should see the output with the list of monitored logs and files.
CopyMonitored Directories:
$SPLUNK_HOME/var/log/splunk
/opt/splunkforwarder/var/log/splunk/audit.log
/opt/splunkforwarder/var/log/splunk/btool.log
/opt/splunkforwarder/var/log/splunk/conf.log
/opt/splunkforwarder/var/log/splunk/first_install.log
/opt/splunkforwarder/var/log/splunk/health.log
/opt/splunkforwarder/var/log/splunk/license_usage.log
/opt/splunkforwarder/var/log/splunk/mongod.log
/opt/splunkforwarder/var/log/splunk/remote_searches.log
/opt/splunkforwarder/var/log/splunk/scheduler.log
/opt/splunkforwarder/var/log/splunk/searchhistory.log
/opt/splunkforwarder/var/log/splunk/splunkd-utility.log
/opt/splunkforwarder/var/log/splunk/splunkd_access.log
/opt/splunkforwarder/var/log/splunk/splunkd_stderr.log
/opt/splunkforwarder/var/log/splunk/splunkd_stdout.log
/opt/splunkforwarder/var/log/splunk/splunkd_ui_access.log
$SPLUNK_HOME/var/log/splunk/license_usage_summary.log
/opt/splunkforwarder/var/log/splunk/license_usage_summary.log
$SPLUNK_HOME/var/log/splunk/metrics.log
/opt/splunkforwarder/var/log/splunk/metrics.log
$SPLUNK_HOME/var/log/splunk/splunkd.log
/opt/splunkforwarder/var/log/splunk/splunkd.log
$SPLUNK_HOME/var/log/watchdog/watchdog.log*
/opt/splunkforwarder/var/log/watchdog/watchdog.log
$SPLUNK_HOME/var/run/splunk/search_telemetry/*search_telemetry.json
$SPLUNK_HOME/var/spool/splunk/...stash_new
Monitored Files:
$SPLUNK_HOME/etc/splunk.version
/var/log/all.log
/var/log/audit/audit.log
Search and View Reports
Do the following to search and view reports:
- Log in to the Splunk Web UI.
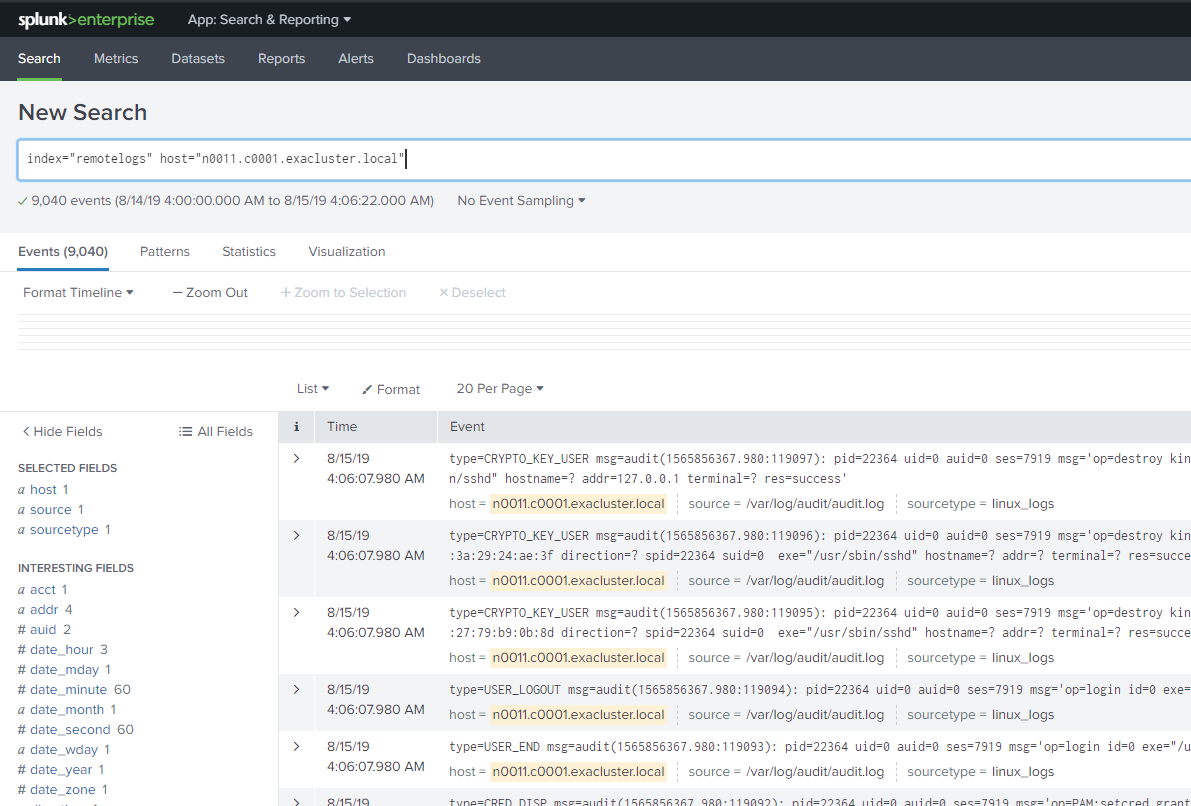
- In the App bar, click Search and Reporting.

- Enter your search query in the search bar and press Enter.

Collect Metrics
You can install Splunk Add-on for Unix and Linux to collect metrics from your server. Do the following to install and configure the plug-in:
- Download the plug-in from Splunkbase.
- Unpack and copy the package to Splunk Forwarder folder.
tar xf splunk-add-on-for-unix-and-linux_602.tgz
mv Splunk_TA_nix /opt/splunkforwarder/etc/apps/
- Edit the
inputs.conffile to enable the metrics you want to collect.vim /opt/splunkforwarder/etc/apps/Splunk_TA_nix/default/inputs.conf
- Set
disable = 0to enable the metrics in the file and save it. - Restart the Splunk forwarder.
/opt/splunkforwarder/bin/splunk stop
/opt/splunkforwarder/bin/splunk start
